Building a Complete AI Agent Evaluation Ecosystem: From Instrumentation to Intelligence

Author: Kshitij Thakkar Date: November 2025 Tags: MCP, Agent Evaluation, OpenTelemetry, Gradio, Google Gemini, HuggingFace
![]()
TraceVerse: A Complete AI Agent Evaluation Ecosystem
Introduction
Everyone wants to ship AI agents. Almost nobody can prove they work.
Most teams are still stuck with:
- scattered logs,
- ad-hoc eval scripts,
- screenshots of leaderboards,
- zero understanding of why a specific agent or model fails.
So I built TraceVerse — a 4-project open-source ecosystem that turns raw agent runs into traces, metrics, datasets, and AI-powered insights you can actually act on.
Instead of "I think this model is better," you get:
"Here's the trace, the cost, the failure pattern, the GPU profile, and the dataset backing that conclusion."
TL;DR – What TraceVerse Actually Does
TraceVerse is four projects that plug into each other:
TraceVerde (
genai_otel_instrument) Zero-code OpenTelemetry instrumentation for LLMs, agents, tools, and infra. → Every LLM call, tool call, DB query, vector search is traced with tokens, cost, latency, GPU, CO₂.SMOLTRACE (
smoltrace) Evaluation engine built onsmolagents. → Runs agent evals and writes 4 Hugging Face Datasets per run (leaderboard, results, traces, metrics).TraceMind MCP Server MCP server exposing 11 tools + 3 resources + 3 prompts. → Uses Gemini to analyze leaderboards, debug traces, estimate costs, generate synthetic tasks, and push datasets.
TraceMind-AI (Gradio app) Interactive UI + autonomous agent on top of the MCP server. → Lets you explore evals, compare models, inspect traces, estimate cost, and ask "why did this fail?" as a natural language query.
End result: You go from "I ran some agents and logged numbers" to "I have reproducible HF datasets, full OTEL traces, and an agent that can explain my agents."
Why This Matters for Hugging Face
This ecosystem is built around Hugging Face, not just "using it":
- Every SMOLTRACE evaluation creates 4 structured
datasetson the Hub (leaderboard, results, traces, metrics). - TraceMind MCP Server and TraceMind-AI run as Hugging Face Spaces, using Gradio's MCP integration.
- The stack is designed for
smolagents– agents are evaluated, traced, and analyzed using HF's own agent framework. - Evaluations can be executed via HF Jobs, turning evaluations into real compute usage, not just local scripts.
So TraceVerse isn't just another toy agent demo. It's an opinionated blueprint for:
"How Hugging Face models + Datasets + Spaces + Jobs + smolagents + MCP can work together as a complete agent evaluation and observability platform."
From here, the rest of this post dives into the four projects, how they fit together, and what I learned building the full pipeline.
The TraceVerse Ecosystem
🔭 TraceVerde                    📊 SMOLTRACE
(genai_otel_instrument)         (Evaluation Engine)
        ↓                               ↓
    Instruments                    Evaluates
    LLM calls                      agents
        ↓                               ↓
        └───────────┬───────────────────┘
                    ↓
            Generates Datasets
        (leaderboard, traces, metrics)
                    ↓
        ┌───────────┴───────────────────┐
        ↓                               ↓
🛠️ TraceMind MCP Server         🧠 TraceMind-AI
(AI-Powered Analysis)           (Interactive Platform)
The Four Projects
| Project | Purpose | Technology | Distribution |
|---|---|---|---|
| TraceVerde | Zero-code OpenTelemetry instrumentation | Python, OTEL SDK | PyPI |
| SMOLTRACE | Agent evaluation engine | Python, smolagents | PyPI |
| TraceMind MCP Server | AI-powered analysis tools | Gradio, MCP, Gemini | HuggingFace Space |
| TraceMind-AI | Interactive evaluation platform | Gradio, smolagents | HuggingFace Space |
Project 1: TraceVerde (genai_otel_instrument)
![]()
Why it exists: You can't fix what you can't see. TraceVerde gives you zero-code observability for every LLM call, tool invocation, and agent step—with automatic cost enrichment, GPU metrics, and CO₂ tracking. Instead of scattered print statements, you get structured OpenTelemetry spans across 17+ providers.
The Problem
You've built an AI agent. Now you want to understand what's happening inside:
- Which LLM calls are being made?
- How long does each step take?
- How many tokens are being consumed?
- What's the cost breakdown?
Traditional logging is scattered and inconsistent. You end up with print statements everywhere, making it impossible to get a unified view of your agent's behavior.
The Solution
TraceVerde provides zero-code OpenTelemetry instrumentation for GenAI applications. Add two lines of code, and every LLM call across 17+ providers is automatically traced with rich semantic attributes.
Installation
pip install genai-otel-instrument
Usage
import genai_otel

# That's it! All LLM calls are now instrumented
genai_otel.instrument()

# Or with explicit configuration
genai_otel.instrument(
    service_name="my-agent",
    exporter_type="otlp",
    endpoint="http://localhost:4318"
)
What Gets Captured
Every LLM call automatically includes:
{
    "gen_ai.system": "openai",
    "gen_ai.request.model": "gpt-4",
    "gen_ai.operation.name": "chat",
    "gen_ai.usage.prompt_tokens": 150,
    "gen_ai.usage.completion_tokens": 89,
    "gen_ai.usage.total_tokens": 239,
    "gen_ai.usage.cost.total": 0.0045,  # Auto-enriched!
    "gen_ai.response.finish_reasons": ["stop"]
}
Key Features
- Zero-Code Instrumentation: No decorators, no wrappers—just
instrument()and you're done - 17+ Provider Support: OpenAI, Anthropic, Google, Cohere, Mistral, and more
- Cost Enrichment: Automatic cost calculation for 340+ models across 20 providers
- Framework Integration: Works with LangChain, LlamaIndex, smolagents, CrewAI
- Standard OTEL Export: Send traces to Jaeger, Zipkin, or any OTEL-compatible backend
Technical Architecture
# Core instrumentation flow
┌─────────────────┐     ┌──────────────────┐     ┌─────────────────┐
│  Your Agent     │ ──▶ │  TraceVerde      │ ──▶ │  OTEL Exporter  │
│  (any provider) │     │  (auto-patches)  │     │  (traces/spans) │
└─────────────────┘     └──────────────────┘     └─────────────────┘
                               │
                               ▼
                        ┌──────────────────┐
                        │  Cost Enricher   │
                        │  (340+ models)   │
                        └──────────────────┘
TraceVerde uses Python's import hooks to automatically patch LLM client libraries. When you call openai.chat.completions.create(), TraceVerde:
- Intercepts the call
- Creates an OTEL span with semantic attributes
- Executes the original call
- Records response attributes (tokens, finish reason)
- Enriches with cost data from the pricing database
- Exports the span to your configured backend
Traction
- 5,000+ downloads in the first month
- Used by SMOLTRACE for all evaluation instrumentation
- Production-ready with comprehensive test coverage
Project 2: SMOLTRACE
![]()
Why it exists: Evaluation shouldn't be a one-time script that dies when the terminal closes. SMOLTRACE runs agent benchmarks (tool-calling, code generation) and writes 4 versioned HF Datasets per run—so every eval becomes reproducible, shareable, and queryable data instead of lost stdout.
The Problem
You want to evaluate your AI agent against a benchmark. Existing solutions are either:
- Too complex (require deep framework knowledge)
- Too rigid (only work with specific models)
- Too opaque (no visibility into what's happening)
And critically—they don't let you evaluate on your own domain-specific tasks.
The Solution
SMOLTRACE is a lightweight evaluation engine built on HuggingFace's smolagents library. It evaluates agents on tool-calling and code-generation capabilities while generating structured datasets for analysis.
Installation
pip install smoltrace
Usage
# Evaluate an API model
smoltrace-eval \
  --model openai/gpt-4 \
  --provider litellm \
  --agent-type both \
  --enable-otel \
  --results-repo kshitij/smoltrace-results-gpt4 \
  --traces-repo kshitij/smoltrace-traces-gpt4 \
  --leaderboard-repo kshitij/smoltrace-leaderboard

# Evaluate a local GPU model
smoltrace-eval \
  --model meta-llama/Llama-3.1-8B \
  --provider transformers \
  --enable-gpu-metrics \
  --hardware gpu_h200
The Four Dataset Structure
Every evaluation generates four structured datasets:
1. Leaderboard Dataset
Aggregate statistics for comparison:
{
    "run_id": "uuid",
    "model": "openai/gpt-4",
    "success_rate": 95.8,
    "total_tests": 100,
    "avg_duration_ms": 3200.0,
    "total_cost_usd": 0.05,
    "co2_emissions_g": 0.22,
    "gpu_utilization_avg": 67.5
}
2. Results Dataset
Per-test-case outcomes:
{
    "task_id": "task_001",
    "success": True,
    "response": "The weather in Tokyo is 18°C",
    "tool_called": "get_weather",
    "execution_time_ms": 2450.0,
    "tokens": 234,
    "cost_usd": 0.0012,
    "trace_id": "trace_abc123"
}
3. Traces Dataset
OpenTelemetry spans for deep debugging:
{
    "trace_id": "trace_abc123",
    "spans": [
        {"name": "Agent Execution", "duration_ms": 2450},
        {"name": "LLM Call - Reasoning", "tokens": 123},
        {"name": "Tool Call - get_weather", "latency_ms": 890}
    ]
}
4. Metrics Dataset
GPU utilization and environmental data:
{
    "gpu_utilization": 67.5,
    "gpu_memory_mib": 512.34,
    "co2_emissions_g": 0.22
}
Custom Dataset Support
The killer feature: evaluate on your own domain tasks.
# Your custom task format
{
    "id": "finance_001",
    "prompt": "What's the current stock price of AAPL?",
    "expected_tool": "get_stock_price",
    "difficulty": "easy",
    "agent_type": "tool",
    "expected_keywords": ["AAPL", "price", "$"]
}
This lets you:
- Benchmark models on industry-specific tasks
- Test proprietary tools and APIs
- Track improvement as you fine-tune
Traction
- 2,000+ downloads in the first week
- Generates datasets used by TraceMind MCP Server
- Supports both API and GPU-based evaluations
Project 3: TraceMind MCP Server
![]()
Why it exists: Datasets are just data—they don't tell you what to do. TraceMind MCP Server wraps 11 tools around SMOLTRACE datasets and uses Gemini to turn raw eval data into actionable insights: "Which model should I use?", "Why did this trace fail?", "How much will 1000 tests cost?"
The Problem
You've run evaluations with SMOLTRACE. Now you have datasets. But datasets are just data—they don't tell you:
- What patterns exist in the failures?
- Which model should you choose for production?
- How much will scaling cost?
You need intelligence, not just data.
The Solution
TraceMind MCP Server provides 17 MCP components (11 tools + 3 resources + 3 prompts) that transform raw evaluation data into actionable insights using Google Gemini 2.5 Flash.
Why MCP?
The Model Context Protocol (MCP) is a standard for exposing tools to AI assistants. By implementing TraceMind as an MCP server, it can be used by:
- Claude Desktop
- VSCode/Cursor with MCP extensions
- Any MCP-compatible client
- Other AI agents (like TraceMind-AI!)
The 11 Tools
AI-Powered Analysis (5 tools)
1. analyze_leaderboard
# Input
analyze_leaderboard(
    leaderboard_repo="kshitij/smoltrace-leaderboard",
    metric_focus="cost",
    top_n=5
)

# Output: AI-generated insights
"""
Based on 51 evaluations:

**Top Performers by Cost Efficiency:**
1. GPT-4o-nano: $0.002/run (93.4% accuracy)
2. Qwen3-MoE: $0.003/run (91.2% accuracy)
3. Llama-3.1-8B: $0.001/run (89.8% accuracy)

**Key Insight:** GPT-4o-nano offers the best cost/accuracy
tradeoff at 6x cheaper than GPT-4 with only 2.4% accuracy drop.

**Recommendation:** For cost-sensitive production workloads,
consider GPT-4o-nano or Llama-3.1-8B on GPU.
"""
2. debug_trace
# Input
debug_trace(
    trace_id="trace_abc123",
    traces_repo="kshitij/smoltrace-traces-gpt4",
    question="Why was the tool called twice?"
)

# Output: AI-powered trace analysis
"""
Based on the trace analysis:

1. **First tool call (span_003)**: Called `search_web` at 14:23:19
   - Reasoning: Initial results were outdated (result_age: "2 days")

2. **Second tool call (span_005)**: Called `search_web` at 14:23:21
   - Modified query: Added "latest" keyword
   - Result: Fresh data retrieved

**Root Cause:** The agent's iterative refinement behavior.
This is expected for complex queries requiring current data.

**Performance Impact:** +2.09s latency, +$0.0003 cost
"""
3. estimate_cost
# Input
estimate_cost(
    model="openai/gpt-4",
    agent_type="tool",
    num_tests=500,
    hardware="auto"
)

# Output: Detailed cost breakdown
"""
**Cost Estimate for 500 Tests**

| Component | Cost |
|-----------|------|
| Input Tokens | $1.25 |
| Output Tokens | $2.50 |
| Tool Calls | $0.15 |
| **Total** | **$3.90** |

**Hardware:** CPU (API model detected)
**Estimated Duration:** 45 minutes
**CO2 Emissions:** 0g (API provider offset)

**Optimization Tips:**
- Use GPT-4o-nano for 6x cost reduction
- Batch similar queries to reduce overhead
"""
4. compare_runs
# Compare two evaluation runs
compare_runs(
    run_id_1="run_gpt4_20251120",
    run_id_2="run_llama_20251120",
    comparison_focus="cost"
)
5. analyze_results
# Deep dive into test results
analyze_results(
    results_repo="kshitij/smoltrace-results-gpt4",
    analysis_focus="failures",
    max_rows=100
)
Token-Optimized Tools (2 tools)
A critical design decision: avoid token bloat.
The full leaderboard has 51 runs. Returning all data to an LLM would waste tokens. Instead:
6. get_top_performers - Returns only top N models (90% token reduction) 7. get_leaderboard_summary - Returns aggregate stats only (99% token reduction)
# Instead of 51 full records...
get_leaderboard_summary(leaderboard_repo="...")

# Returns just:
{
    "total_runs": 51,
    "unique_models": 12,
    "avg_success_rate": 87.3,
    "best_model": "gpt-4",
    "most_cost_effective": "gpt-4o-nano"
}
Data Management Tools (4 tools)
8. get_dataset - Load any SMOLTRACE dataset as JSON 9. generate_synthetic_dataset - Create domain-specific test tasks using AI 10. generate_prompt_template - Generate smolagents prompt templates 11. push_dataset_to_hub - Upload datasets to HuggingFace Hub
Synthetic Dataset Generation
One of the most powerful features:
generate_synthetic_dataset(
    domain="food-delivery",
    tool_names="search_restaurants,view_menu,place_order,track_delivery",
    num_tasks=100,
    difficulty_distribution="balanced"
)
This generates 100 realistic test tasks for your domain:
{
    "id": "food_001",
    "prompt": "Order a margherita pizza from Antonio's for delivery",
    "expected_tool": "place_order",
    "difficulty": "easy",
    "agent_type": "tool"
}
Batched Generation: Requests >20 tasks are automatically split into parallel batches for efficiency.
MCP Resources & Prompts
Beyond tools, the server exposes:
3 Resources (direct data access):
leaderboard://{repo}- Raw leaderboard JSONtrace://{trace_id}/{repo}- Raw trace datacost://model/{model}- Pricing information
3 Prompts (standardized templates):
analysis_prompt- For leaderboard/cost/performance analysisdebug_prompt- For trace debugging scenariosoptimization_prompt- For optimization recommendations
Technical Architecture
┌─────────────────────────────────────────────────────────────┐
│                    TraceMind MCP Server                      │
├─────────────────────────────────────────────────────────────┤
│  Gradio App (mcp_server=True)                               │
│  ├── @gr.mcp.tool() decorated functions (11)                │
│  ├── @gr.mcp.resource() decorated functions (3)             │
│  └── @gr.mcp.prompt() decorated functions (3)               │
├─────────────────────────────────────────────────────────────┤
│  MCP Transport Layer                                         │
│  ├── SSE Endpoint: /gradio_api/mcp/sse                      │
│  └── HTTP Endpoint: /gradio_api/mcp/                        │
├─────────────────────────────────────────────────────────────┤
│  Core Services                                               │
│  ├── GeminiClient (gemini-2.5-flash-lite)                   │
│  ├── HuggingFace Datasets API                               │
│  └── Cost Calculator (340+ model pricing)                   │
└─────────────────────────────────────────────────────────────┘
Connecting to the Server
Auto-Config (Easiest):
- Visit https://huggingface.co/settings/mcp
- Add:
MCP-1st-Birthday/TraceMind-mcp-server - Copy config to your MCP client
Manual Config (Claude Desktop):
{
  "mcpServers": {
    "tracemind": {
      "url": "https://mcp-1st-birthday-tracemind-mcp-server.hf.space/gradio_api/mcp/sse",
      "transport": "sse"
    }
  }
}
Demo Videos
Watch the MCP server in action with Claude Desktop:
- Quick Demo (5 min): Watch on Loom
- Full Demo (20 min): Watch on Loom
Social Media
Read the announcement and join the discussion:
- [TODO: Add Twitter/X post link]
- [TODO: Add LinkedIn post link]
- [TODO: Add HuggingFace Discord announcement link]
Project 4: TraceMind-AI
![]()
Why it exists: Not everyone uses Claude Desktop or wants to write MCP client code. TraceMind-AI is a Gradio app that anyone can open in a browser—with an autonomous agent, leaderboard explorer, trace debugger, and eval job launcher. It's the MCP server made visual and accessible.
The Problem
The MCP server is powerful, but you need an MCP client to use it. What if you want:
- A visual interface for exploring evaluation data?
- An autonomous agent that can answer complex questions?
- The ability to submit new evaluation jobs?
The Solution
TraceMind-AI is a Gradio-based platform that serves as both:
- A visual dashboard for evaluation data
- An autonomous agent that consumes the MCP server
Key Screens
1. Leaderboard View
- Load live evaluation data from HuggingFace
- Sort by accuracy, cost, latency, CO2
- AI-generated insights via MCP
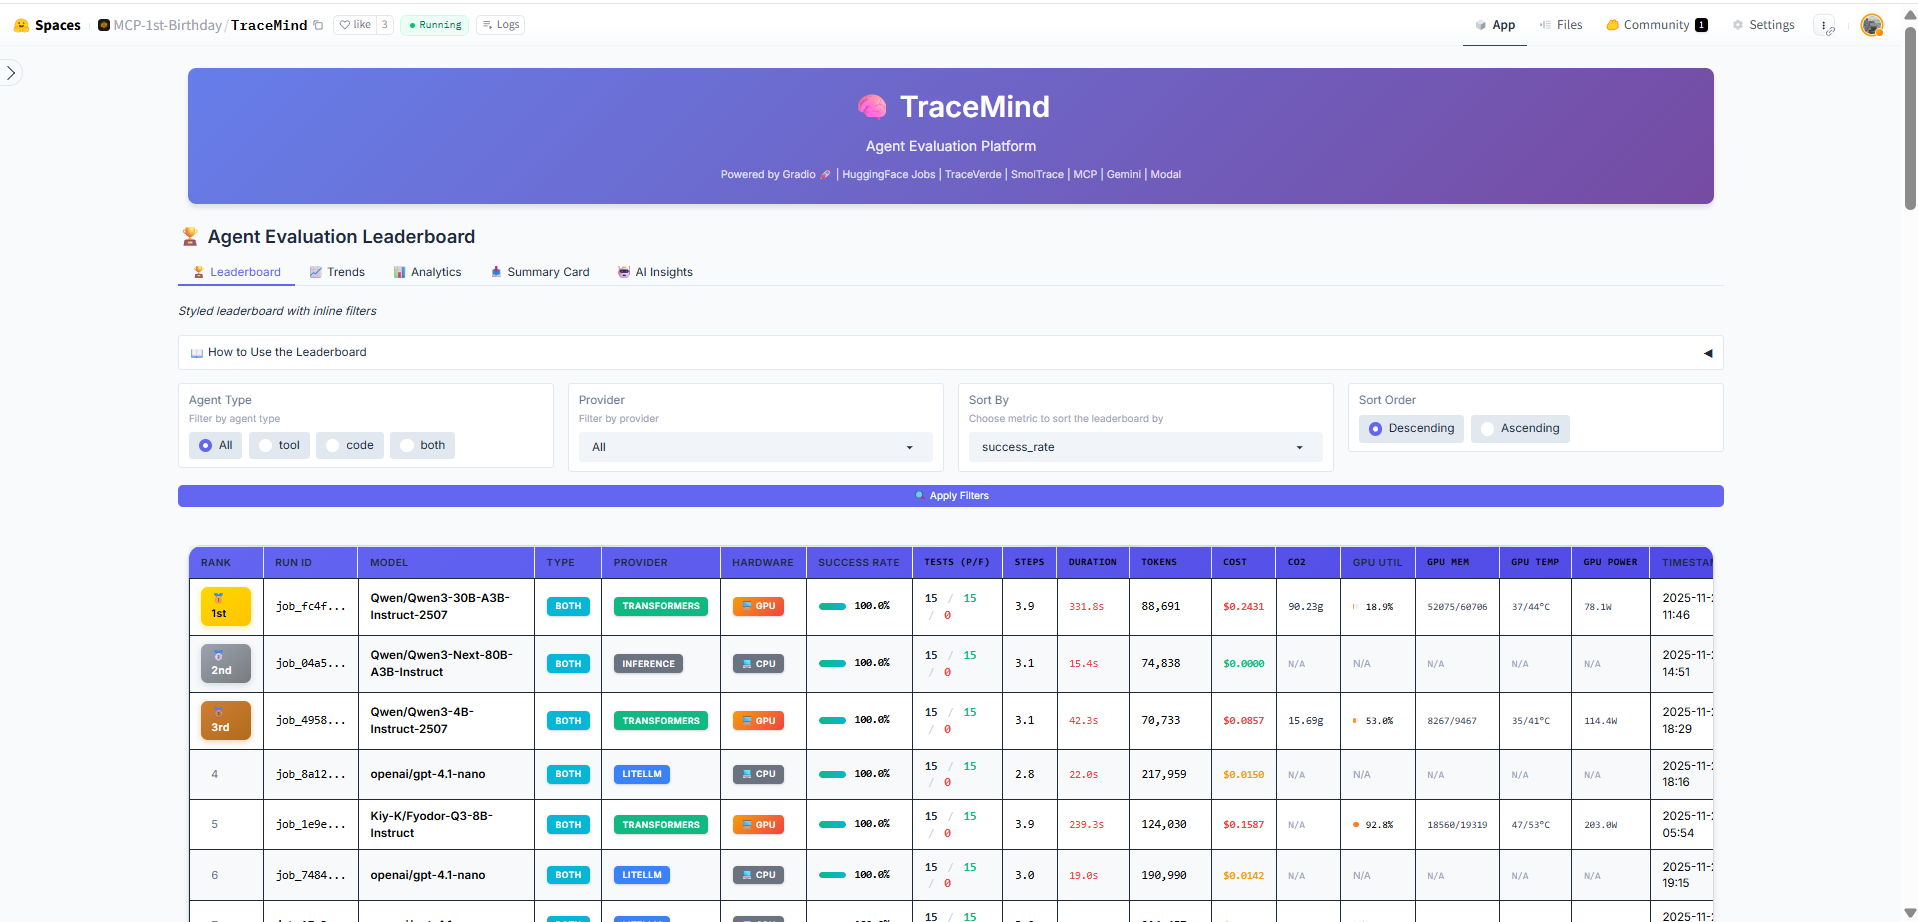 The Leaderboard displays all evaluation runs with sortable columns and AI-powered insights
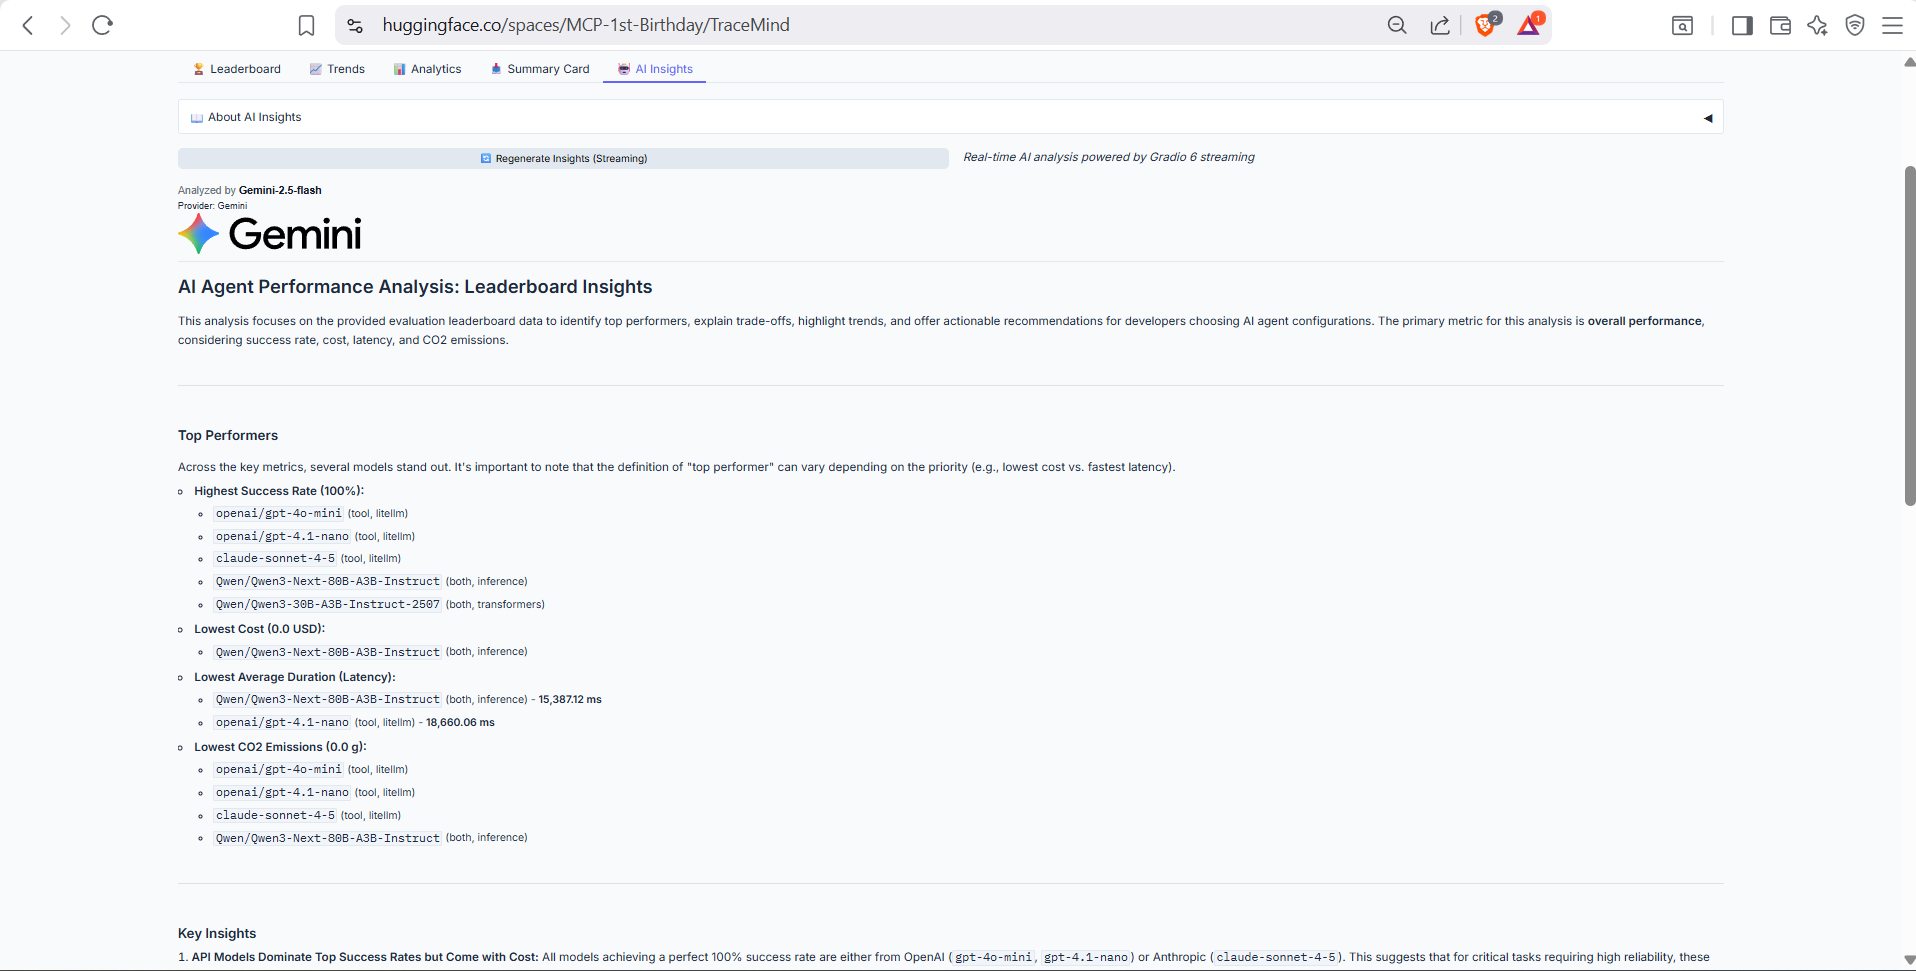 AI-generated insights analyze trends, top performers, and provide recommendations
2. Agent Chat (The Star Feature)
Ask complex questions and watch the agent work:
User: "Compare the top 3 models by cost-effectiveness
       and recommend one for 1000 production tests"

Agent Reasoning:
├── Planning: Need to get top performers, then estimate costs
├── Calling: get_top_performers(top_n=3)
├── Calling: estimate_cost(model="gpt-4o-nano", num_tests=1000)
├── Calling: estimate_cost(model="qwen3-moe", num_tests=1000)
├── Calling: estimate_cost(model="llama-3.1-8b", num_tests=1000)
└── Synthesizing: Comprehensive recommendation

Agent Response:
"Based on my analysis of the top 3 models:

1. **GPT-4o-nano** - $3.90 for 1000 tests (93.4% accuracy)
2. **Qwen3-MoE** - $4.50 for 1000 tests (91.2% accuracy)
3. **Llama-3.1-8B** - $2.10 for 1000 tests (89.8% accuracy)

**Recommendation**: For production, I recommend GPT-4o-nano.
While Llama is cheapest, GPT-4o-nano's 3.6% accuracy advantage
justifies the $1.80 premium for 1000 tests..."
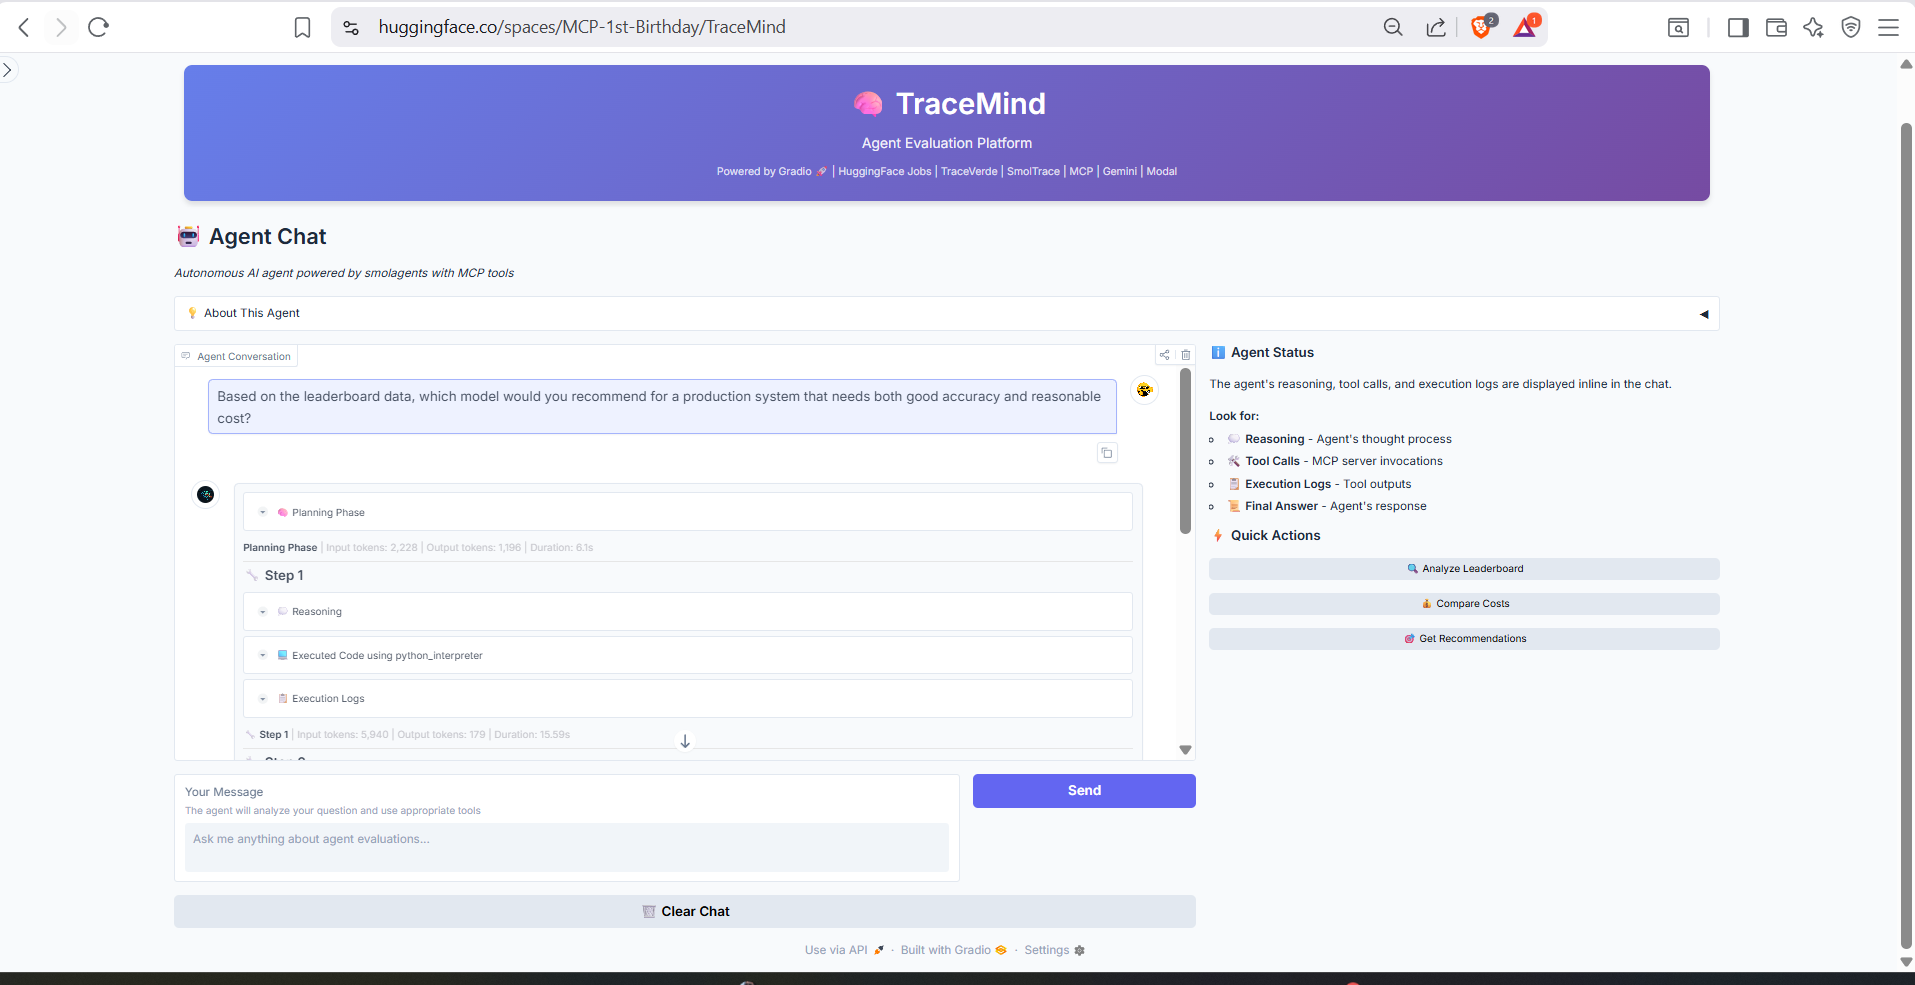 The Agent Chat shows the agent's reasoning process and tool calls in real-time
3. Cost Estimation
- Calculate costs before running evaluations
- Compare API vs GPU options
- See environmental impact
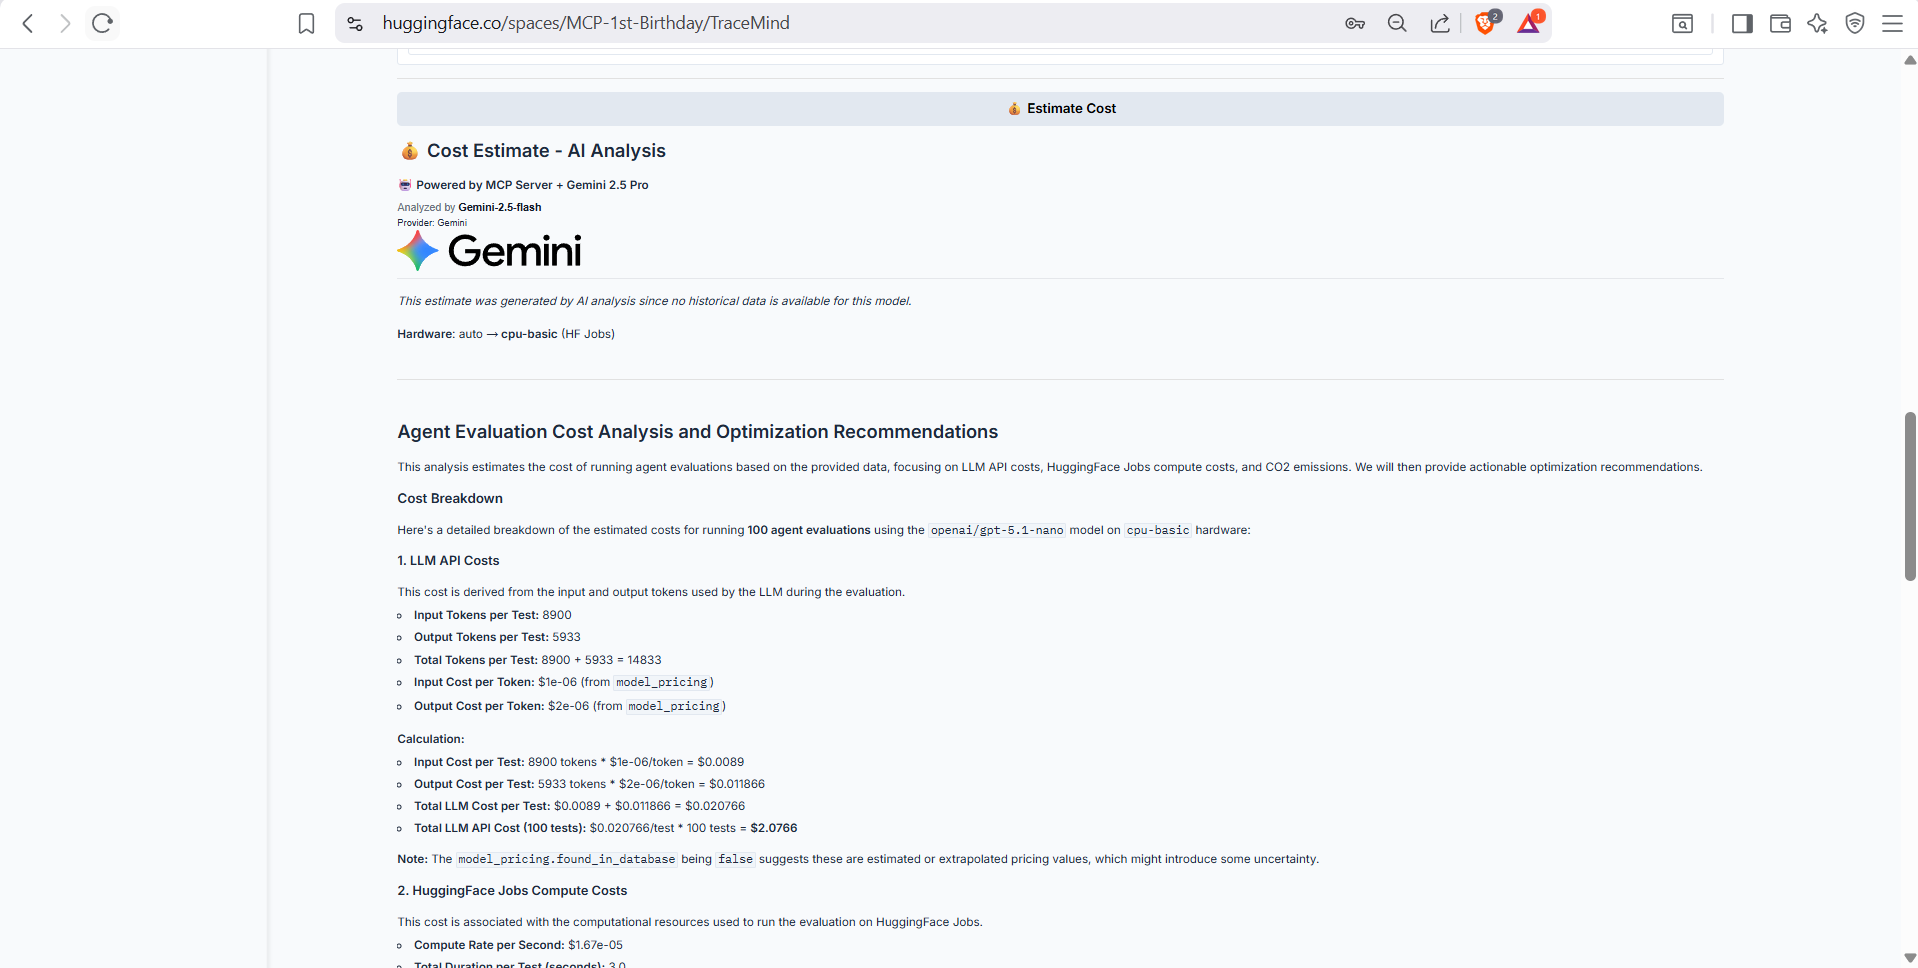 Real-time cost estimation before submitting evaluation jobs
4. Trace Visualization
- OpenTelemetry trace waterfall diagrams
- AI-powered Q&A about specific traces
- GPU metrics overlay
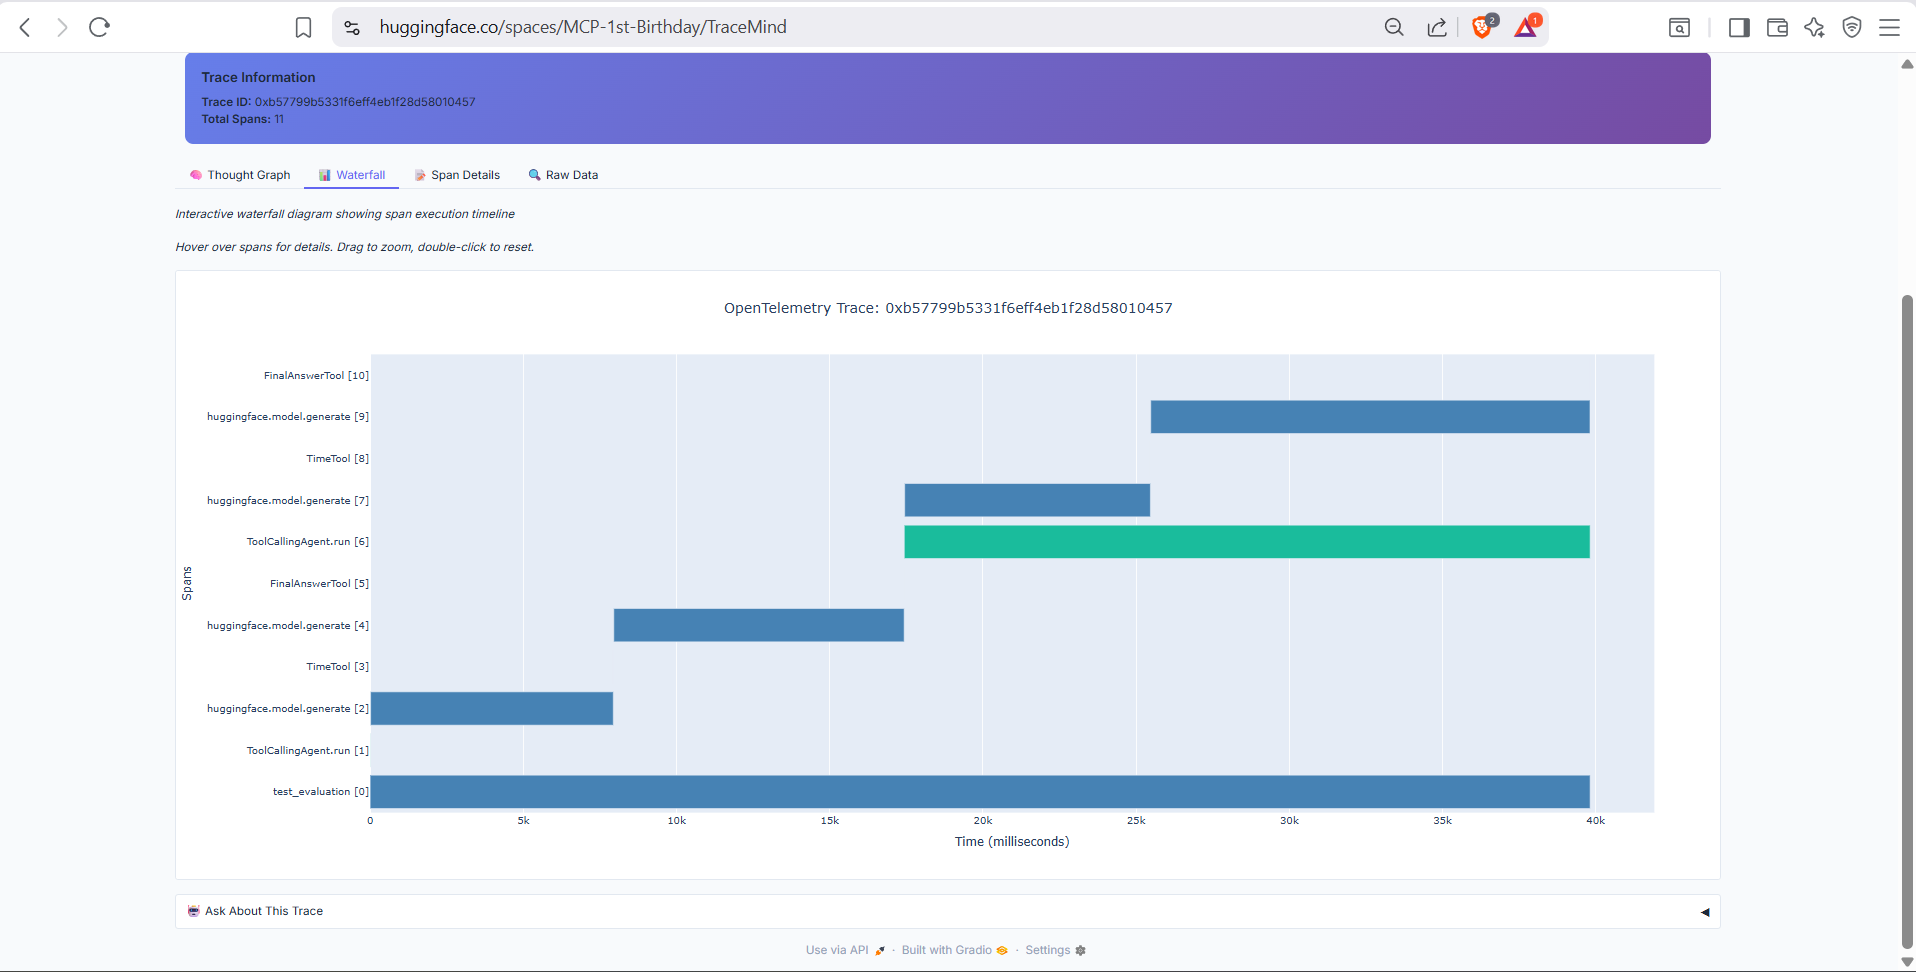 Waterfall view showing the complete execution flow with timing information
5. New Evaluation
- Submit jobs to HuggingFace Jobs or Modal
- Hardware selection (CPU, A10, H200)
- Real-time job monitoring
6. Compare Runs
- Side-by-side comparison of evaluation runs
- Radar chart visualization across multiple dimensions
- AI-powered comparison analysis
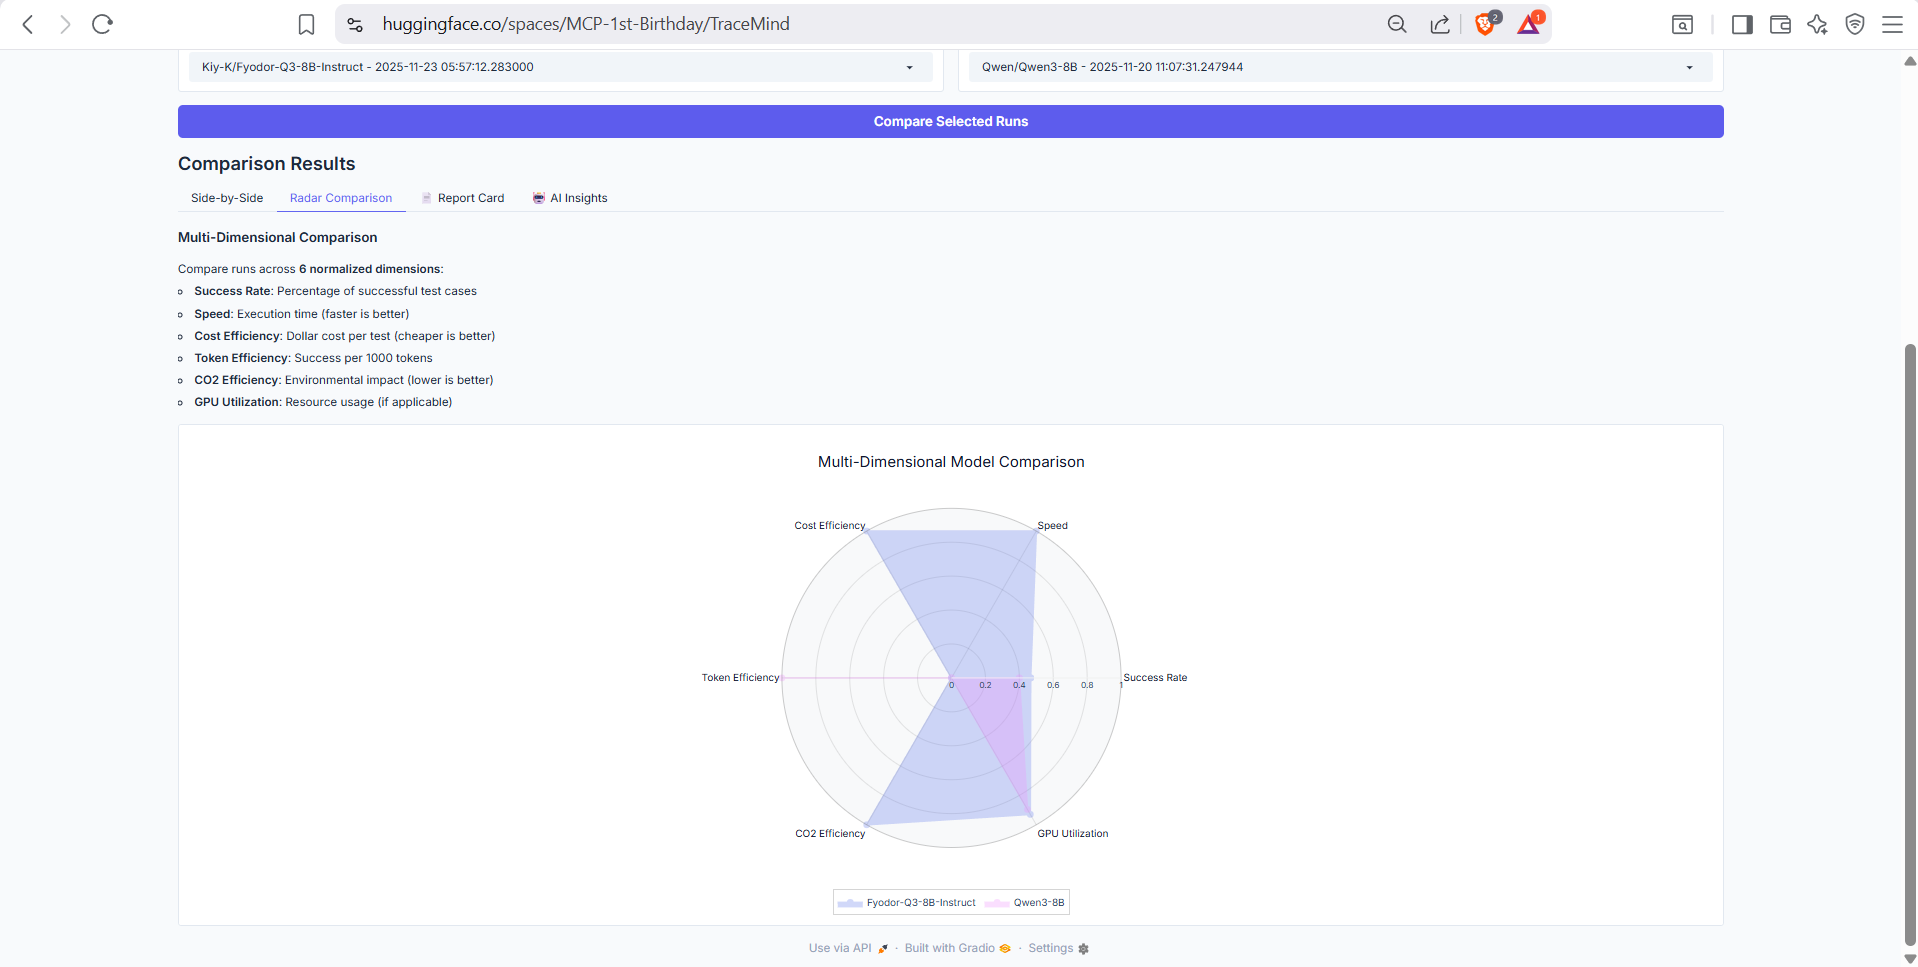 Radar chart comparing runs across accuracy, speed, cost efficiency, and more
7. Synthetic Data Generator
- Create custom evaluation datasets
- Generate matching prompt templates
- Push directly to HuggingFace Hub
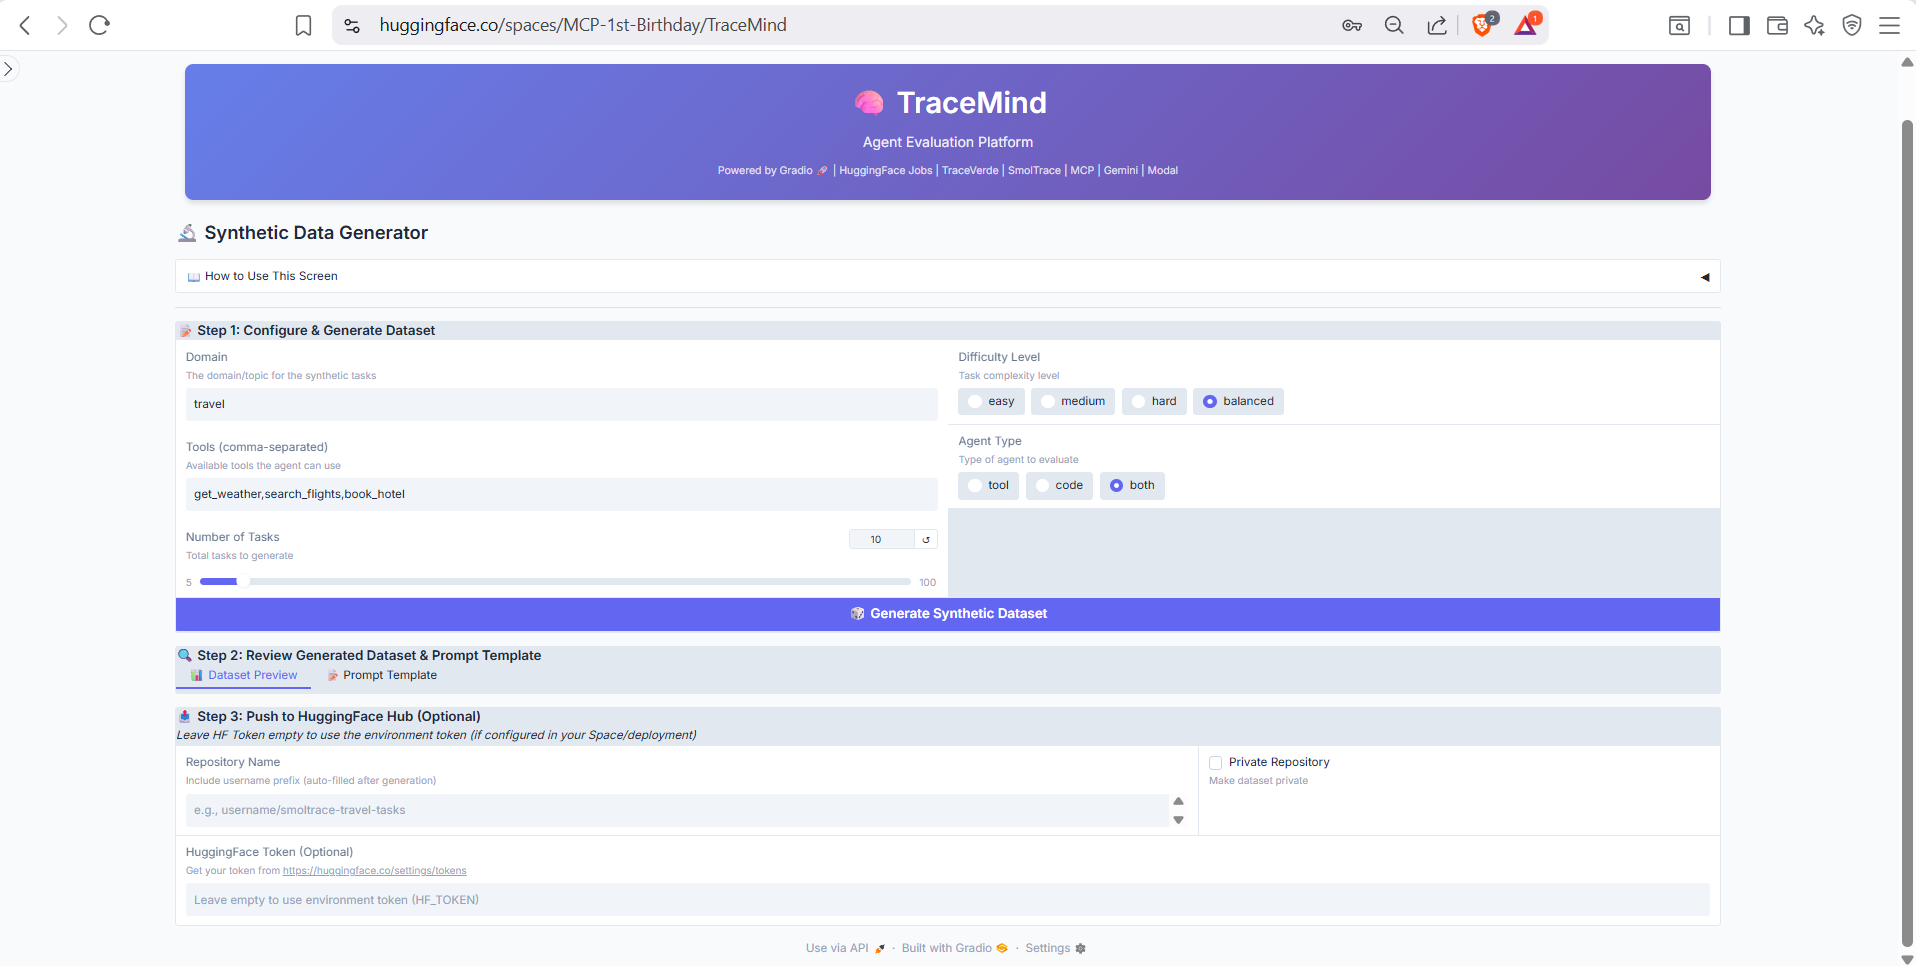 Generate domain-specific test datasets with AI-powered generation
Dual MCP Integration
TraceMind-AI demonstrates two MCP patterns:
Pattern 1: Direct MCP Client
from mcp import ClientSession

async def call_mcp_tool(tool_name, arguments):
    async with ClientSession(sse_url) as session:
        result = await session.call_tool(tool_name, arguments)
        return result.content[0].text
Pattern 2: Autonomous Agent with MCP Tools
from smolagents import ToolCallingAgent, Tool

# Wrap MCP tools for smolagents
class MCPTool(Tool):
    def __init__(self, mcp_client, tool_name):
        self.mcp_client = mcp_client
        self.tool_name = tool_name

    def forward(self, **kwargs):
        return self.mcp_client.call_tool(self.tool_name, kwargs)

# Create autonomous agent
agent = ToolCallingAgent(
    tools=[MCPTool(client, "analyze_leaderboard"), ...],
    model=gemini_model
)

# Agent autonomously decides which tools to call
response = agent.run("Compare the top 3 models...")
Technical Architecture
┌─────────────────────────────────────────────────────────────┐
│                      TraceMind-AI                            │
├─────────────────────────────────────────────────────────────┤
│  Gradio Frontend (6 Screens)                                │
│  ├── Leaderboard (data table + AI insights)                 │
│  ├── Agent Chat (autonomous reasoning)                      │
│  ├── Cost Estimation (calculators)                          │
│  ├── Trace Visualization (waterfall diagrams)               │
│  ├── New Evaluation (job submission)                        │
│  └── Synthetic Data Generator                               │
├─────────────────────────────────────────────────────────────┤
│  MCP Client Layer                                           │
│  ├── SSE Connection to TraceMind MCP Server                 │
│  ├── sync_wrapper.py (async-to-sync bridge)                 │
│  └── Tool response caching                                  │
├─────────────────────────────────────────────────────────────┤
│  Agent Framework (smolagents)                               │
│  ├── ToolCallingAgent with MCP tools                        │
│  ├── Reasoning visibility (show agent's thought process)    │
│  └── Multi-step task execution                              │
├─────────────────────────────────────────────────────────────┤
│  Data Layer                                                 │
│  ├── HuggingFace Datasets API                               │
│  ├── HuggingFace Jobs API (job submission)                  │
│  └── Modal API (alternative compute)                        │
└─────────────────────────────────────────────────────────────┘
Demo Videos
Watch TraceMind-AI in action:
- [TODO: Add Quick Demo video link (5 min)]
- [TODO: Add Full Demo video link (20 min)]
- [TODO: Add Agent Chat Demo video link]
Social Media
Read the announcement and join the discussion:
- [TODO: Add Twitter/X post link]
- [TODO: Add LinkedIn post link]
- [TODO: Add HuggingFace Discord announcement link]
The Complete Data Flow
Let's trace a complete workflow through all four projects:
Step 1: Instrument Your Agent (TraceVerde)
import genai_otel
genai_otel.instrument()

# Your agent code runs normally, but now it's traced
agent.run("What's the weather in Tokyo?")
Step 2: Run Evaluation (SMOLTRACE)
smoltrace-eval \
  --model openai/gpt-4 \
  --enable-otel \
  --results-repo myuser/smoltrace-results-gpt4 \
  --leaderboard-repo myuser/smoltrace-leaderboard
Output: 4 HuggingFace datasets created
Step 3: Analyze with AI (TraceMind MCP Server)
In Claude Desktop:
"Analyze the leaderboard at myuser/smoltrace-leaderboard
 and tell me which model I should use for production"
Output: AI-powered insights with specific recommendations
Step 4: Deep Dive (TraceMind-AI)
Open TraceMind-AI, ask the autonomous agent:
"Why did test task_045 fail? Show me the trace
 and explain what went wrong"
Output: The agent calls multiple MCP tools, retrieves the trace, and provides a detailed explanation with the reasoning visible.
Lessons Learned
1. Token Optimization is Critical
Early versions returned full datasets to the LLM. With 51 leaderboard entries, this wasted thousands of tokens per request.
Solution: Created get_top_performers and get_leaderboard_summary tools that return only what's needed. This reduced token usage by 90-99%.
2. Async-to-Sync Bridging is Tricky
Gradio runs synchronously, but MCP clients are async. The sync_wrapper.py module handles this:
def run_sync(coro):
    """Run async code from sync context"""
    loop = asyncio.new_event_loop()
    try:
        return loop.run_until_complete(coro)
    finally:
        loop.close()
3. Batched Generation Scales
Generating 100 synthetic tasks in one Gemini call would hit token limits. Instead:
# Split into batches of 20
batches = [tasks[i:i+20] for i in range(0, len(tasks), 20)]

# Generate in parallel
results = await asyncio.gather(*[
    generate_batch(batch) for batch in batches
])
4. Show the Agent's Reasoning
Users don't trust black-box answers. TraceMind-AI shows the agent's complete reasoning:
- Which tools it decided to call
- Why it made those decisions
- The intermediate results
This transparency builds trust and helps debugging.
Hackathon Submission
This ecosystem was built for MCP's 1st Birthday Hackathon (November 14-30, 2025).
Track 1: Building MCP (Enterprise)
Project: TraceMind MCP Server
- 17 MCP components (11 tools + 3 resources + 3 prompts)
- AI-powered analysis with Gemini 2.5 Flash
- Token-optimized design for enterprise use
Track 2: MCP in Action (Enterprise)
Project: TraceMind-AI
- Autonomous agent consuming remote MCP server
- Dual MCP integration patterns
- Complete evaluation platform
Why Dual-Track?
The same underlying technology, presented from two angles:
- Track 1: "Here's how to BUILD powerful MCP servers"
- Track 2: "Here's how to CONSUME MCP servers in autonomous agents"
Together, they demonstrate the full MCP ecosystem potential.
Try It Yourself
Quick Start
Connect MCP Server to Claude Desktop:
- Visit https://huggingface.co/settings/mcp
- Add:
MCP-1st-Birthday/TraceMind-mcp-server
Try TraceMind-AI:
- Visit https://huggingface.co/spaces/MCP-1st-Birthday/TraceMind
- Ask the agent a question about agent evaluation
Run Your Own Evaluations:
pip install smoltrace
smoltrace-eval --model openai/gpt-4 --enable-otel
Links
| Project | Live Demo | GitHub | PyPI |
|---|---|---|---|
| TraceVerde | - | GitHub | PyPI |
| SMOLTRACE | - | GitHub | PyPI |
| TraceMind MCP Server | HuggingFace | GitHub | - |
| TraceMind-AI | HuggingFace | GitHub | - |
Demo Videos
- MCP Server Quick Demo (5 min): Watch on Loom
- MCP Server Full Demo (20 min): Watch on Loom
Conclusion
Building the TraceMind ecosystem taught me that the real value isn't in the data—it's in the intelligence layer on top.
Anyone can generate evaluation metrics. The hard part is:
- Understanding why failures happen
- Making informed decisions about which model to use
- Predicting costs before committing resources
By combining OpenTelemetry instrumentation (TraceVerde), structured evaluation (SMOLTRACE), AI-powered analysis (TraceMind MCP Server), and an autonomous agent interface (TraceMind-AI), we've created a complete solution for AI agent evaluation.
The Model Context Protocol makes this possible by providing a standard way to expose tools to AI assistants. Whether you're using Claude Desktop, building your own agent, or integrating with other MCP clients, TraceMind's tools are available.
The future of AI development is observable, measurable, and intelligent.
Acknowledgments
- Anthropic - For creating MCP and hosting this hackathon
- Gradio - For native MCP support that made this possible
- HuggingFace - For Spaces, Datasets, and the smolagents library
- Google - For Gemini 2.5 Flash powering all AI analysis
- Modal - For providing Infrastruture for evalations
Built with ❤️ for MCP's 1st Birthday Hackathon
Questions? Feedback? Reach out on GitHub or find me in the HuggingFace Discord! or follow me on Linkedin